ATR Indicator Explained: Volatility for Stops and Sizing
The ATR indicator explained in plain language: what Average True Range measures, how to read it, and how to use it for stops and position sizing in a no-code bot.
What ATR actually measures
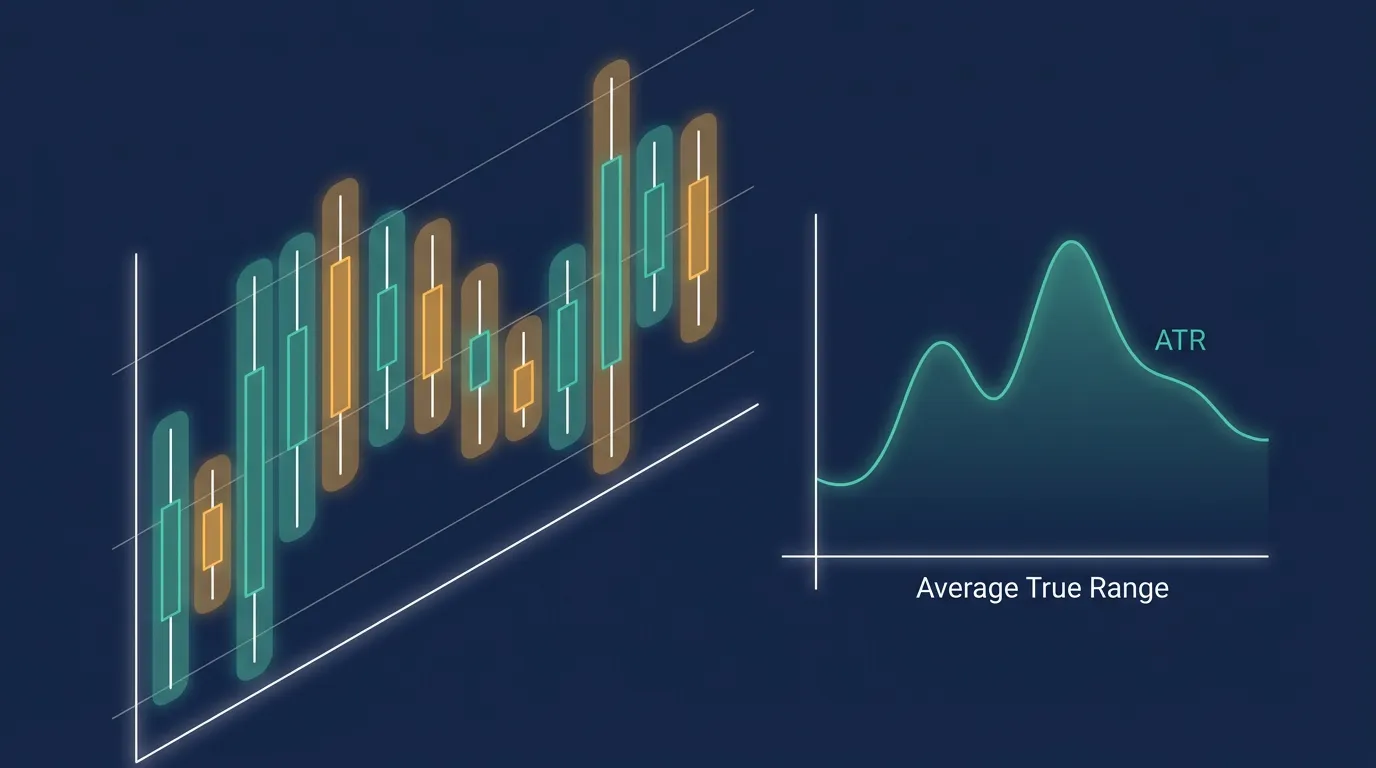
The Average True Range (ATR) is a volatility gauge, not a direction signal. It answers one question: how much does this asset typically move in a single bar?
It does this by averaging the "true range" of recent candles — the full distance a price travels in a period, including any gap from the previous close. A high ATR means wide, fast-moving candles; a low ATR means quiet, tight ones.
ATR is a measure of how much, never which way. It says nothing about trend or whether to buy or sell.
That's the key mental shift. You don't trade ATR crossing a line — you use it to size everything else.
How to read it
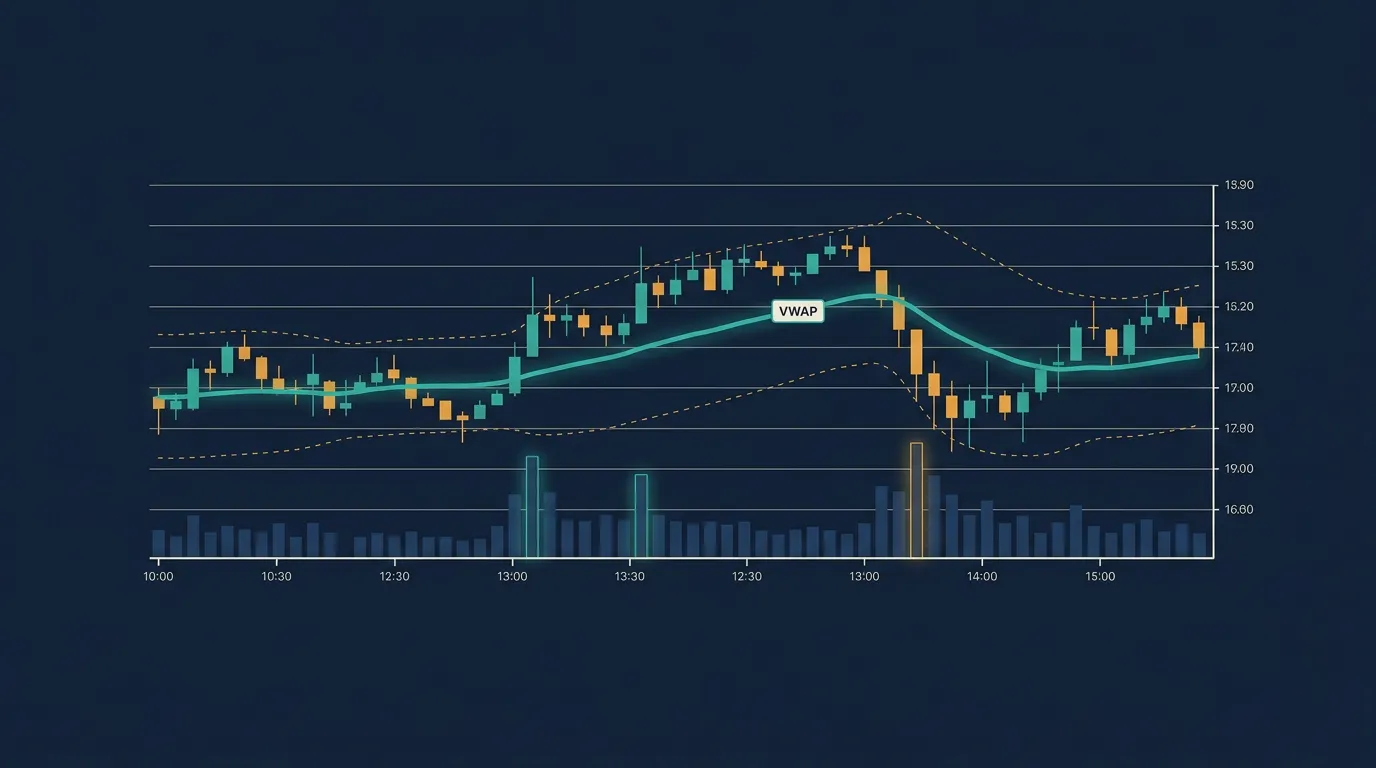
ATR is expressed in the same units as price. An ATR of 40 on a stock trading near 2,000 means the average bar spans roughly 40 points. The same 40 on a 200-dollar stock would be a wildly volatile market. So always read ATR relative to price, not as an absolute number.
A few practical readings:
- Rising ATR — volatility is expanding; moves are getting bigger and stops need more room.
- Falling ATR — the market is calming; ranges are tightening, often before a breakout.
- Very low ATR — compression. Breakout traders watch for this as a coiled-spring setup.
The standard lookback is 14 periods, but shorter settings react faster (and noisier) while longer ones smooth the picture.
Compare current ATR to its own recent average rather than a fixed threshold. "ATR is double its 50-bar norm" travels across assets far better than "ATR above 30".
Using ATR for stops and sizing
This is where ATR earns its place. Because it quantifies normal movement, it lets you set risk that adapts to conditions instead of using a fixed distance.
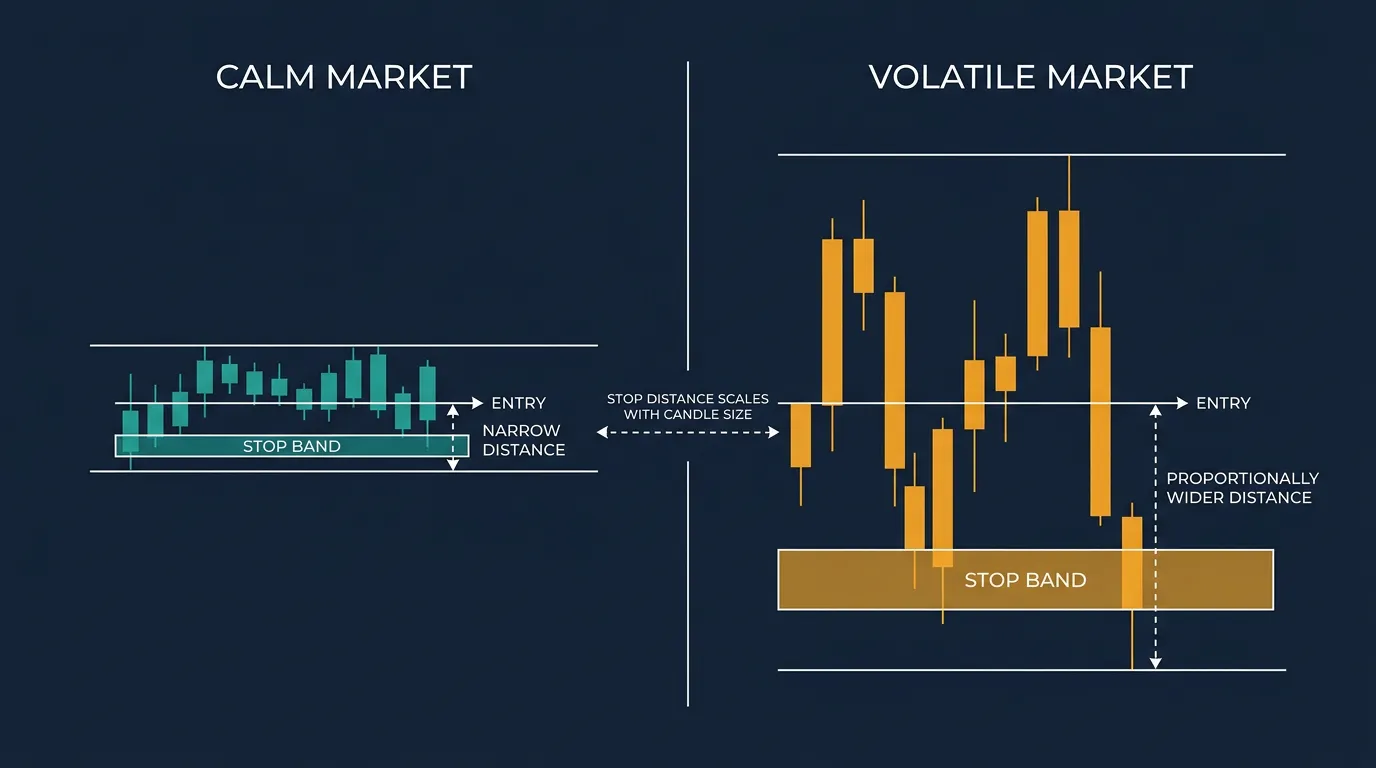
Volatility-based stops. Place your stop a multiple of ATR away from entry — say 2× ATR. In a calm market the stop sits tight; when volatility spikes, it automatically widens so you're not shaken out by ordinary noise. The same logic builds ATR trailing stops that follow price by a volatility-scaled distance.
Position sizing. Risk a fixed amount per trade, then let ATR decide the size. Wide ATR → smaller position; tight ATR → larger one. This keeps your dollar risk roughly constant whether the market is sleepy or wild.
On algomax you don't configure any of this with formulas. You describe it in plain language — "use a 2× ATR trailing stop and size each trade to risk one percent" — and the assistant turns that into a ready-to-run bot. It pairs naturally with a direction signal like a moving-average cross or .
Strengths, limits, and pitfalls
ATR's great strength is objectivity: it adapts your risk to live conditions without guesswork. But mind the limits.
- No direction. ATR never tells you to enter — pair it with a trend or momentum signal.
- It lags. As an average, it reacts after volatility has already changed.
- Units don't compare across assets. Raw ATR on Bitcoin and a forex pair aren't comparable; normalise to price or to ATR's own history.
- Gaps inflate it. A big overnight gap can spike ATR and momentarily widen stops more than you intended.
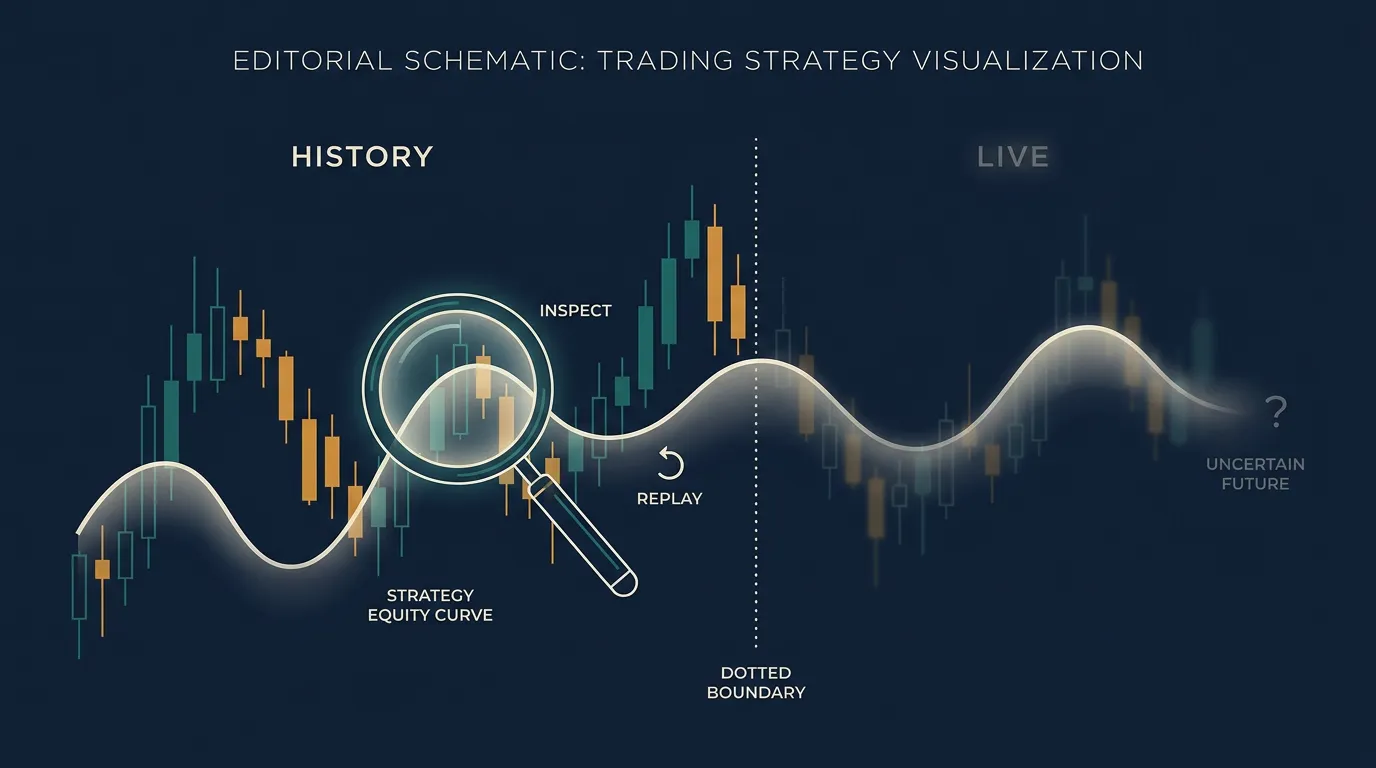
Whatever ATR-based rule you choose, prove it on history first. shows whether your stop multiple survives real volatility or gets chopped up.
Key takeaways
- ATR measures volatility, not direction — always pair it with a directional signal.
- Read it relative to price and to its own recent norm, never as a fixed number.
- Its best jobs are adaptive stops and position sizing that keep risk steady across conditions.
- On a , you describe the ATR rule in plain words and the assistant builds the bot — but backtest before trading live.
Frequently asked questions
What does the ATR indicator tell you?
ATR tells you how much an asset typically moves in one bar — its volatility. It does not indicate direction or signal buy and sell, so it's used to scale risk rather than to enter trades.
What is a good ATR multiplier for stops?
Common choices are 1.5 to 3 times ATR, with around 2x being a typical starting point. The right multiple depends on the asset and timeframe, so test different values on historical data before trading live.
What ATR period should I use?
The default is 14 periods. Shorter settings react faster but produce noisier readings, while longer settings smooth the picture and respond more slowly to volatility changes.
Can I compare ATR across different assets?
Not directly, because ATR is expressed in each asset's price units. To compare, normalise it to price or judge each asset's ATR against its own recent average.
How do I use ATR in a no-code trading bot?
On algomax you describe the rule in plain language — for example a 2x ATR trailing stop with fixed-percentage sizing — and the assistant turns it into a ready-to-run bot. You never write code or formulas.