Golden Cross vs Death Cross: A Trend Signal Reality Check
The golden cross and death cross explained: how these 50/200 moving average signals work, what they miss, and how to automate them without chasing hype.
What the golden cross and death cross actually are
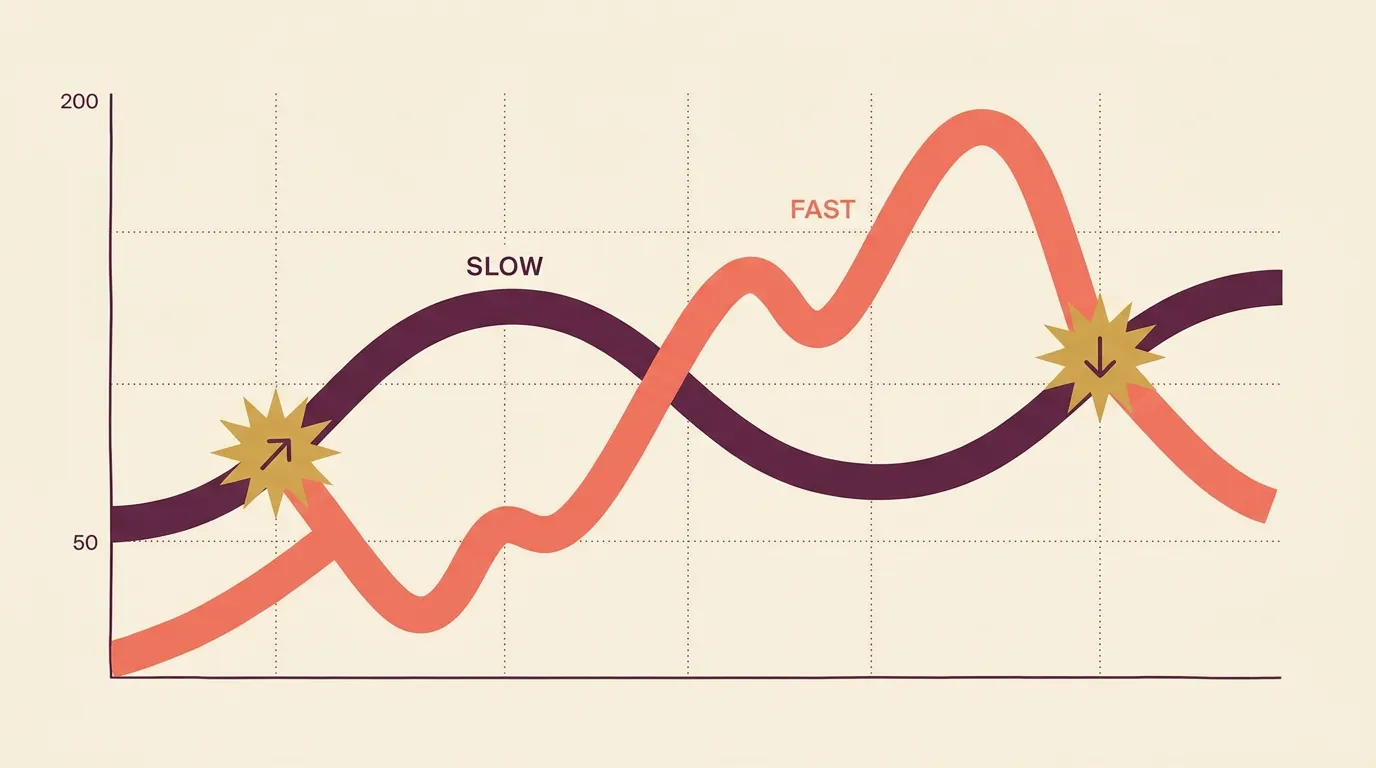
A golden cross happens when a short-term moving average crosses above a long-term one — classically the 50-day crossing above the 200-day. A death cross is the mirror image: the 50 crossing below the 200. That's the whole definition. Everything else — the headlines, the doom, the euphoria — is noise built on top of two lines.
These are regime signals, not entry triggers. They tell you the market's medium-term trend has probably flipped. They say nothing about where to place a stop or when to take profit.
A golden cross confirms a trend that already started weeks ago. It's a rear-view mirror, not a crystal ball.
Why the lag cuts both ways
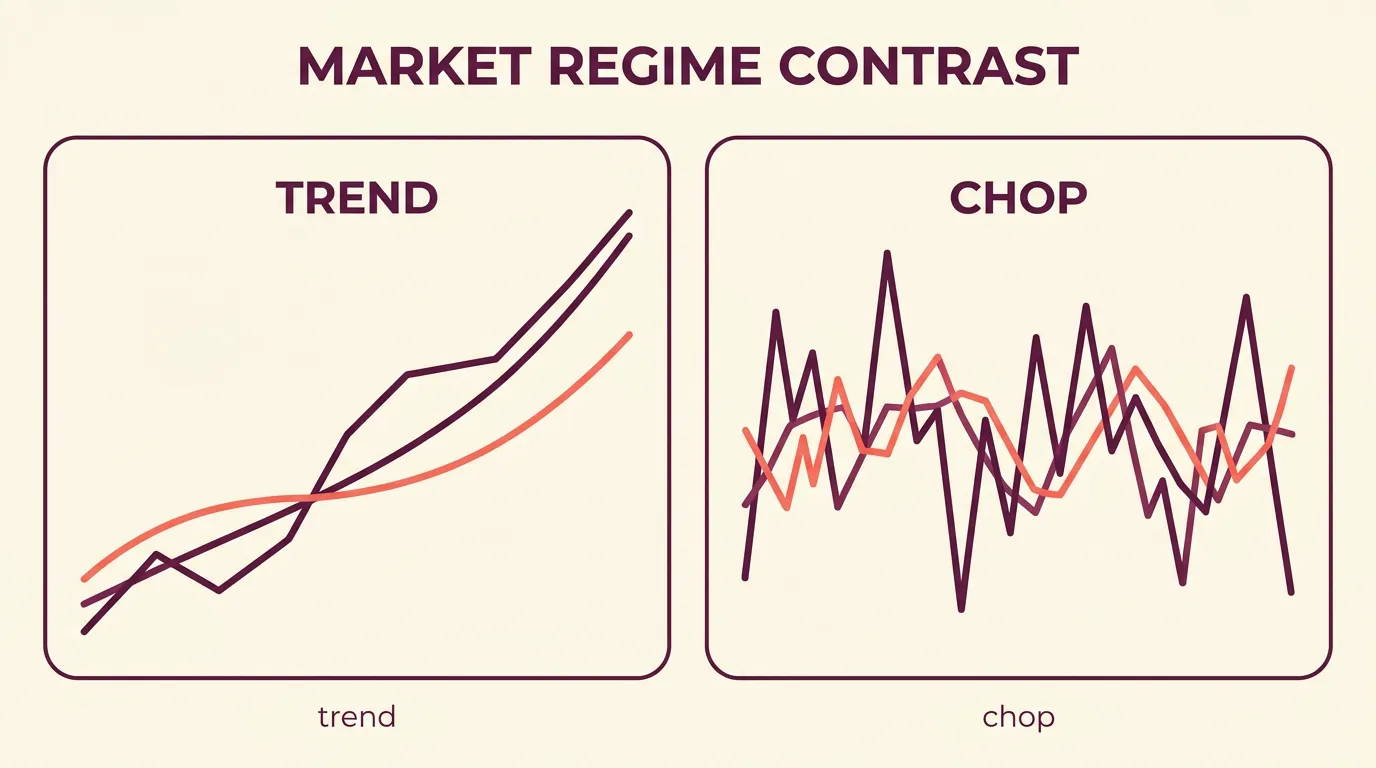
Because both averages are slow, the cross fires long after the actual bottom or top. On a clean, sustained trend that lag is fine — you give up the first leg but ride the bulk of the move. In a choppy, range-bound market the same lag is brutal: price whipsaws across the averages, and you get a death cross right before a bounce and a golden cross right before a drop.
The trade-off in one line:
This is why the signal works beautifully in backtests over trending decades and disappoints in flat years. It's not broken; it's just slow by design.
Turning the cross into a usable strategy
The raw cross is a starting point, not a finished plan. A few ways traders make it tradeable:
- Shorter periods for faster markets. The 50/200 combo suits daily stock charts. On crypto or intraday, shorter pairs (like a 20/50) react quicker — at the cost of more false signals.
- Use it as a filter, not a trigger. Only take long entries while the fast MA sits above the slow one, and let a faster indicator like or a pullback handle the actual timing.
- Require confirmation. Wait for a candle to close beyond the cross, or add a small buffer, to cut whipsaws around the crossover point.
- Pick a side deliberately. A death cross can mean "exit longs" or "open a short" — those are different strategies. Decide whether your bot is before you build it.
Never size a position off the cross alone. Because entries arrive late, your stop can sit far from price — pair the signal with volatility-aware stops using the so risk stays bounded.
Automating it without writing code
The mechanics — watching two averages, waiting for a confirmed cross, checking a filter — are exactly what a bot does well and a human does impatiently. On algomax you describe the rule in plain language ("go long when the 50-period average crosses above the 200-period, exit on the reverse cross") and the AI assistant turns it into a ready-to-run bot.
Then do the unglamorous part: backtest it before going live across both trending and flat periods, not just the years that flatter it. A golden cross strategy that only shines in one bull run is overfit to history.
Key takeaways
- The golden/death cross is a 50/200 moving average crossover marking a medium-term trend flip — a regime signal, not an entry.
- Its lag helps in sustained trends and hurts in chop; expect whipsaws in sideways markets.
- Make it usable with shorter periods, a confirmation close, or by treating it as a trend filter for a faster entry.
- Backtest across mixed conditions and pair it with volatility-based stops before automating.
Frequently asked questions
What is the difference between a golden cross and a death cross?
A golden cross is when a short-term moving average crosses above a long-term one, signalling a possible uptrend. A death cross is the opposite — the short-term average crossing below the long-term one, signalling a possible downtrend.
Which moving averages are used for the classic golden cross?
The traditional version uses the 50-day and 200-day moving averages on a daily chart. Traders using faster markets like crypto or intraday timeframes often shorten these periods to react more quickly.
Is the golden cross a reliable buy signal?
It is a lagging trend signal, not a precise entry. It performs well in strong sustained trends but produces frequent false signals in choppy, sideways markets, so most traders combine it with confirmation or use it as a filter.
Can I automate a golden cross strategy without coding?
Yes. On algomax you describe the crossover rule in plain language and the AI assistant turns it into a ready-to-run bot, which you can backtest on historical candles before going live.
Why should I backtest a moving average cross over different market conditions?
Because the signal shines in trending periods and struggles in flat ones, testing only on a bull run overstates its performance. Testing across mixed conditions gives a more honest picture and helps avoid overfitting.