Z-Score Mean Reversion: Measuring How Far Price Strays
Learn how a z-score turns "price is far from its mean" into a precise, testable mean reversion strategy — entries, exits, and the regime trap to avoid.
What a z-score actually measures
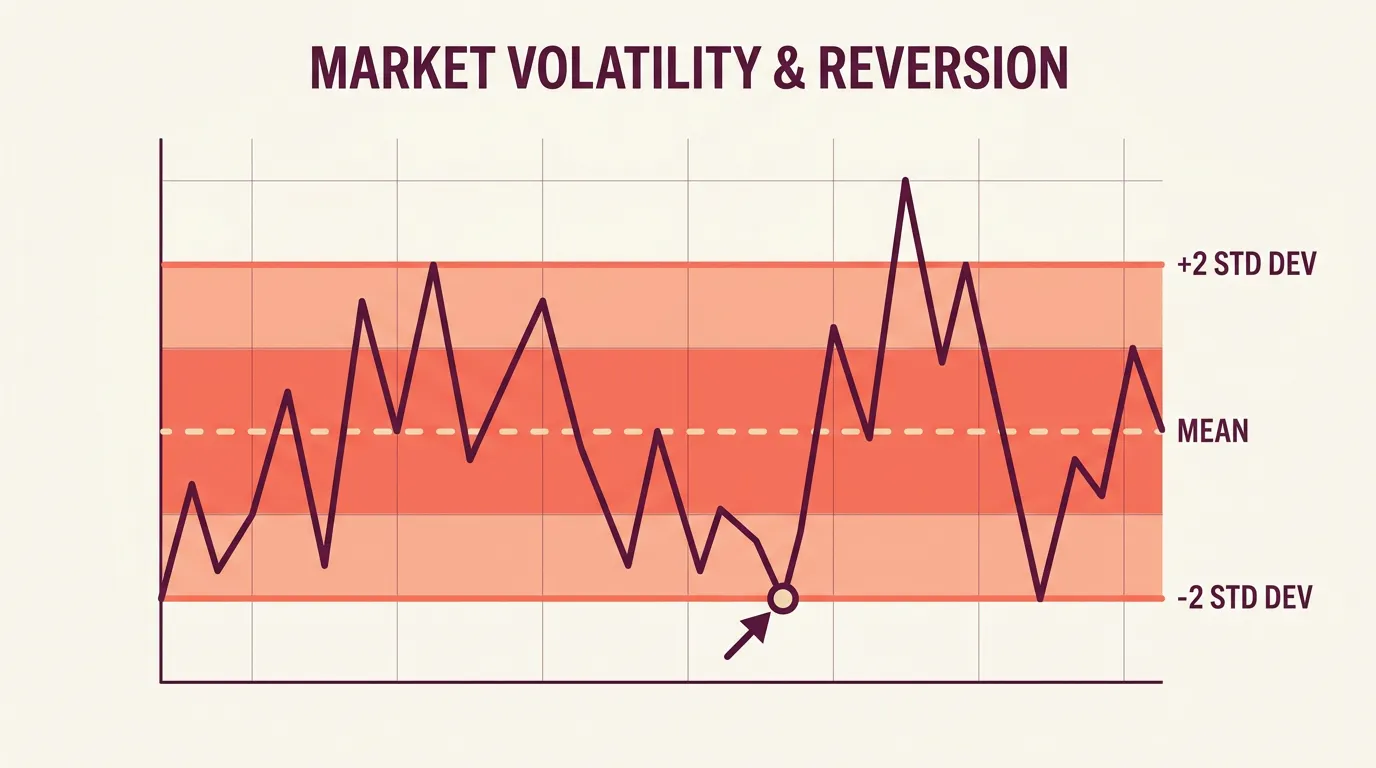
A z-score tells you how many standard deviations price is away from its own recent average. Zero means price sits right on the mean; +2 means it's stretched two standard deviations above; −2 means two below. That's it — it's a normalized distance, not a prediction.
Why bother normalizing? Because "far from the mean" means something different on a calm asset than a volatile one. A raw $500 move might be routine for one instrument and extreme for another. The z-score puts every setup on the same scale, so a threshold like −2 means the same thing across markets and across time.
The recipe is simple to describe in words: take a moving average of price over a lookback window, measure the standard deviation over that same window, then express the current price as its distance from the average divided by that deviation. The bigger the absolute number, the more stretched the market.
Turning z-score into a mean reversion strategy
The classic reversion to the mean logic: fade the extremes and bet price snaps back toward its average.
- Entry: buy when the z-score drops below a low threshold (e.g. −2), sell/short when it climbs above a high one (e.g. +2).
- Exit: close as the z-score returns toward 0 — the mean — rather than waiting for the opposite extreme.
- Lookback: a shorter window (20 periods) reacts fast and fires often; a longer one (50+) is slower but steadier.
The mean isn't a fixed line — it moves with price. A z-score exit near 0 targets that current average, not where the mean was when you entered.
Two thresholds matter: the entry z and the exit z. A wider entry (−2.5) trades less but catches sharper stretches; a tighter one (−1.5) trades more with weaker edges. You don't need to touch any formulas to test this — on a no-code platform you just and the AI turns it into a ready-to-run bot you can backtest.
The regime trap every z-score trader hits
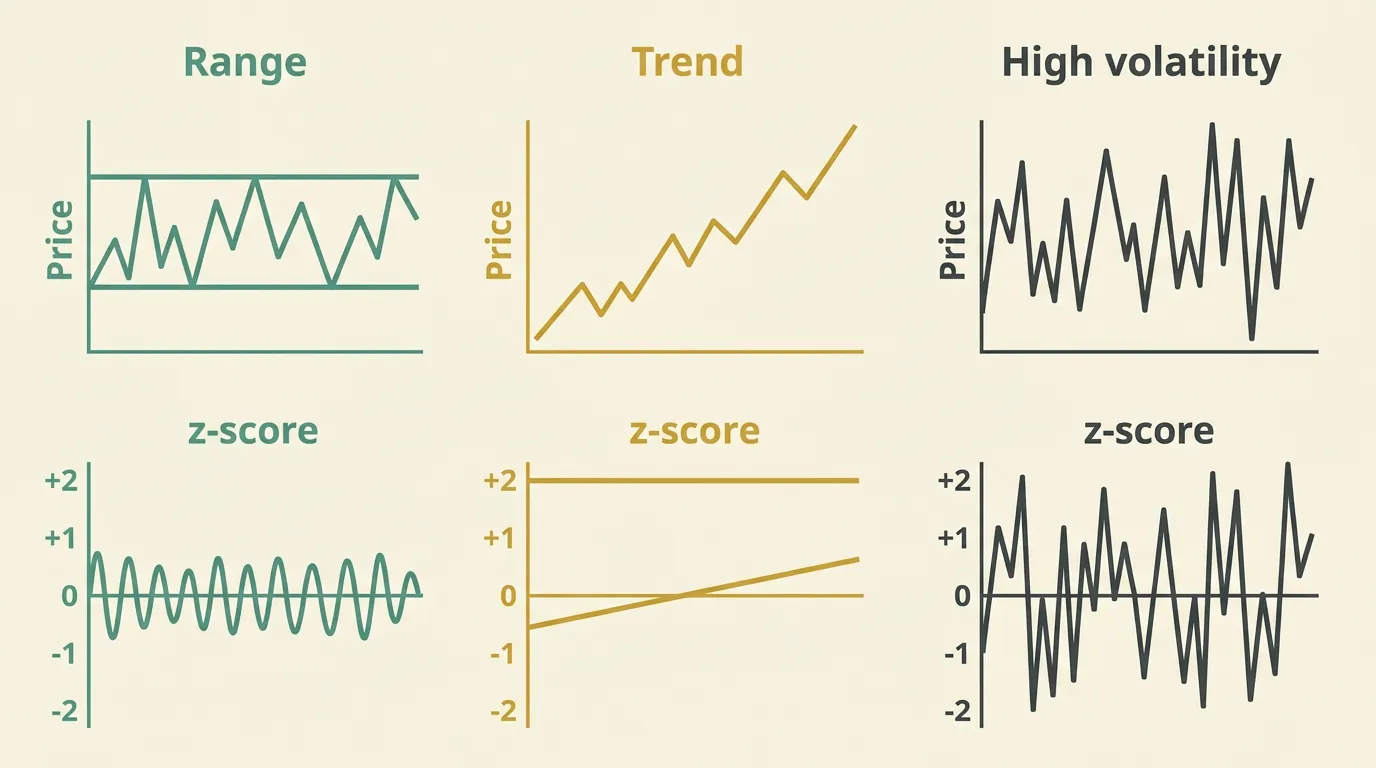
Here's the uncomfortable truth: mean reversion only works when there's a stable mean to revert to. In a strong trend, price can sit at z = −2 and keep falling. Fading it is catching a falling knife.
A z-score never tells you which regime you're in. Add a filter — for example, only take reversion trades when a longer-term trend is flat — or the strategy will bleed during trends.
Practical guardrails:
- Filter by regime. Skip reversion entries when a long moving average is sloping hard.
- Cap the downside. A stretched z can stretch further, so always attach a stop — an adapts to volatility better than a fixed one.
- Validate honestly. Test on data the strategy never saw with before trusting the thresholds.
Testing it before you commit
Thresholds that look perfect on one chart often fall apart elsewhere. , then paper trade before risking real capital. Watch not just the win rate but how the strategy behaves during the trends where it's supposed to struggle — that's where the real risk lives.
Key takeaways
- A z-score normalizes how far price has strayed from its mean, so thresholds mean the same thing everywhere.
- Fade extremes (±2) and exit as the z-score returns toward 0.
- Mean reversion dies in trends — add a regime filter and always use a stop.
- Backtest across regimes and paper trade first; trading always carries risk.
Frequently asked questions
What z-score threshold should I use for entries?
Common choices are ±2 standard deviations, but there's no universal best value. Wider thresholds like ±2.5 trade less often on sharper extremes, while ±1.5 trades more frequently with weaker signals. Backtest across different periods to see what fits your market.
Why use a z-score instead of just RSI for oversold signals?
RSI bounds momentum on a 0–100 scale, while a z-score measures statistical distance from a moving average in standard deviations. The z-score adapts to each asset's own volatility, so a threshold means the same thing across markets. Many traders use them together as confirmation.
Does mean reversion work in a trending market?
Generally no. In a strong trend the mean itself keeps drifting, so price can stay stretched and keep going, turning a fade into a losing position. That's why a regime filter and a stop-loss are essential.
How do I build a z-score strategy without coding?
On a no-code platform like algomax you describe the logic in plain language — entry, exit, and thresholds — and the AI turns it into a ready-to-run bot. You can then backtest and paper trade it before going live, without writing any formulas.