RSI Indicator Explained: Momentum for Automated Bots
The RSI indicator explained in plain language: what it measures, how to read overbought and oversold levels, and how to use it inside a no-code trading bot.
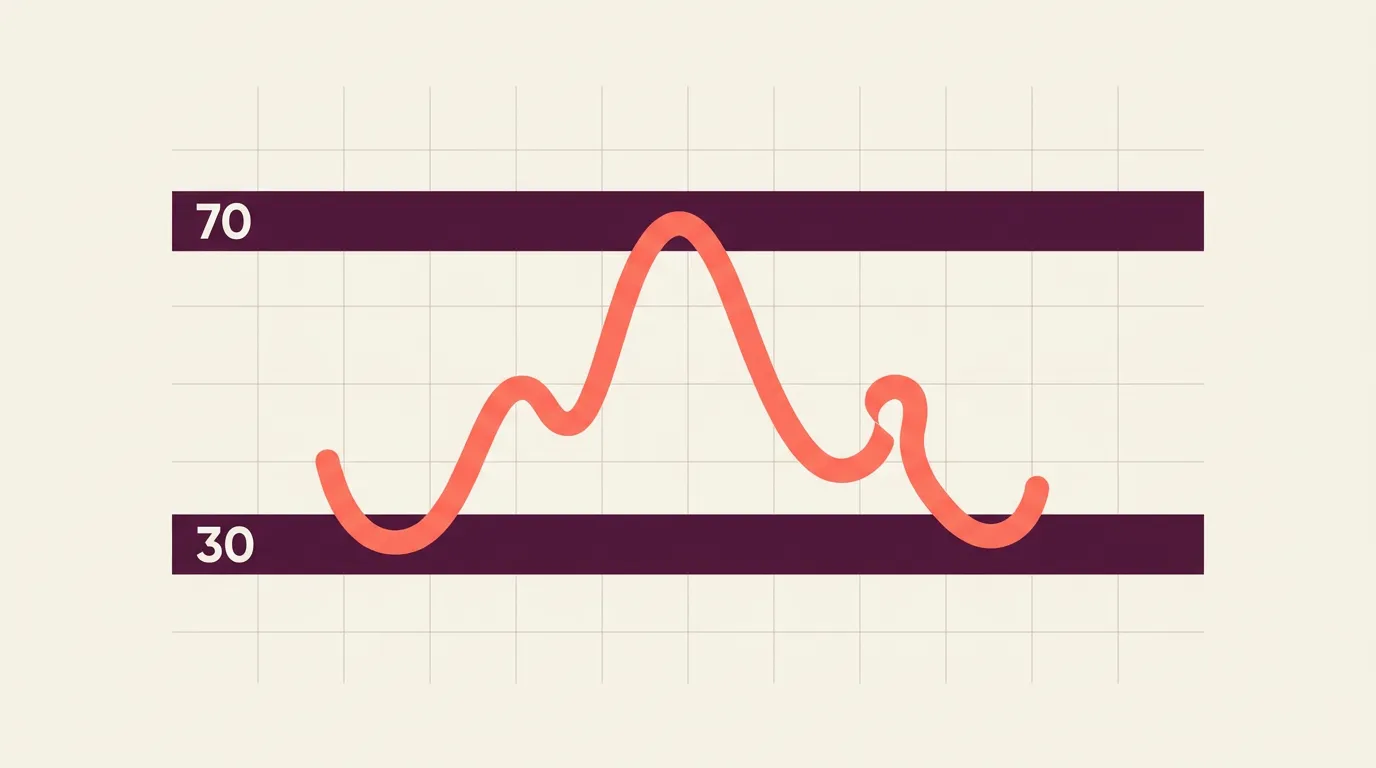
The Relative Strength Index (RSI) is a momentum oscillator that measures how fast and how far price has moved recently, on a scale from 0 to 100. It's one of the first indicators most traders learn — and one of the most misused. Here's how to read it and how to wire it into an automated strategy.
What RSI actually measures
RSI compares the size of recent gains to the size of recent losses over a lookback window (14 periods is the classic default). When gains dominate, RSI rises toward 100; when losses dominate, it falls toward 0.
The number answers one question: is momentum stretched? A reading near the extremes says price has moved a lot in one direction, quickly. It does not tell you the trend will reverse — only that the current push is strong.
- Above 70 — traditionally overbought (strong recent buying)
- Below 30 — traditionally oversold (strong recent selling)
- Around 50 — momentum is balanced; often used as a trend filter
Reading the signals
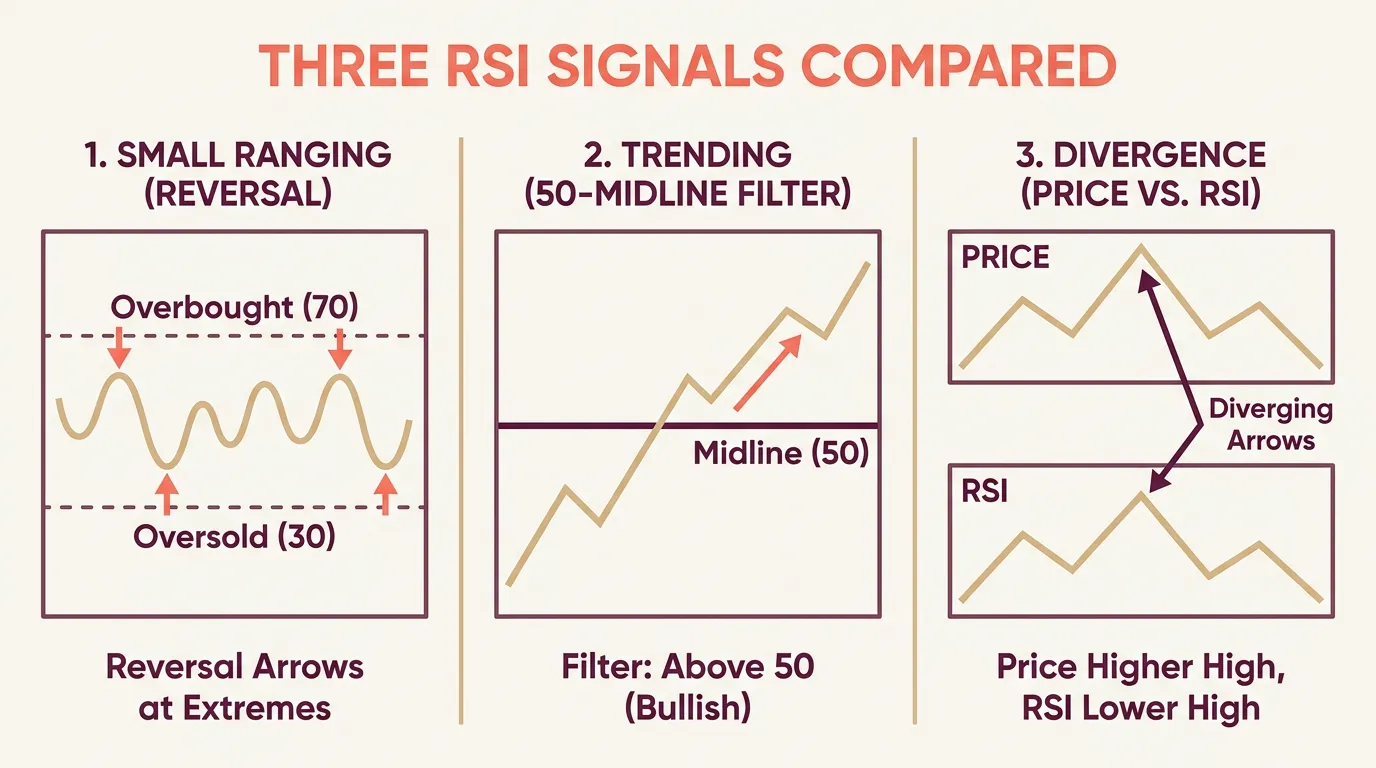
RSI gives three broadly useful signals. Each works better in some market conditions than others.
- Overbought / oversold reversals. Fade the extreme: buy when RSI dips below 30 and turns up, sell when it pushes above 70 and rolls over. This works in ranging markets and fails badly in strong trends.
- Midline crosses as a trend filter. RSI holding above 50 signals bullish momentum; below 50, bearish. Many bots use this as a confirmation rather than a standalone trigger.
- Divergence. Price makes a higher high but RSI makes a lower high (or vice versa) — a hint that momentum is fading beneath the surface.
In a strong uptrend, RSI can sit above 70 for a long time. "Overbought" is not a sell signal on its own — traders who blindly short every 70 reading get run over.
Strengths and limits
RSI is popular because it's simple, bounded, and works across crypto, stocks, and forex. But it has real blind spots.
The biggest fix is context. Pairing RSI with a trend filter — say, only taking oversold bounces when price is above a long moving average — removes many of its worst signals. Combining it with a volatility measure like the helps size positions and place stops sensibly.
RSI tells you momentum is stretched. It never tells you when the rubber band snaps back.
Using RSI in a no-code bot
On algomax you don't code any of this. You describe the strategy in plain language to the AI assistant — for example, "buy when RSI falls below 30 and price is above the 200-period average, exit when RSI crosses back above 50" — and it builds a ready-to-run bot. Writing that description clearly is a skill in itself; our guide on walks through it.
Before going live, always to see how your RSI rules behaved across trending and ranging periods. Tune the lookback and thresholds per asset rather than trusting the 14/70/30 defaults everywhere.
Test at least two market regimes — a strong trend and a sideways range — before trusting an RSI mean-reversion bot. The same rules can shine in one and bleed in the other.
Key takeaways
- RSI measures momentum strength on a 0–100 scale, not future direction.
- Reversal signals suit ranging markets; the 50 midline works as a trend filter.
- Extremes can persist — pair RSI with a trend or volatility filter.
- Describe your RSI rules in plain language, then backtest before going live.
Frequently asked questions
What is a good RSI setting for trading?
The classic default is a 14-period lookback with 70/30 thresholds, but these rarely fit every asset. Faster settings react quicker but whipsaw more; it's best to test different lookbacks and levels per market in a backtest.
Does RSI above 70 mean I should sell?
Not by itself. In a strong uptrend RSI can stay above 70 for a long time, so treating every 70 reading as a sell signal is a common way to lose money. It's more reliable as a filter alongside a trend or divergence signal.
Is RSI better for trending or ranging markets?
RSI's overbought/oversold reversal signals work best in ranging markets. In strong trends the midline (50) as a trend filter tends to be more useful than fading the extremes.
Can I use RSI in an automated bot without coding?
Yes. On algomax you describe your RSI rules in plain language and the AI assistant builds a ready-to-run bot, then you backtest it on historical data before going live. You never write or see code.