Out-of-Sample Testing: Stop Overfitting Your Backtest
Out-of-sample testing separates a strategy that works from one that memorized the past. Learn how to split data, spot overfitting, and validate a backtest honestly.
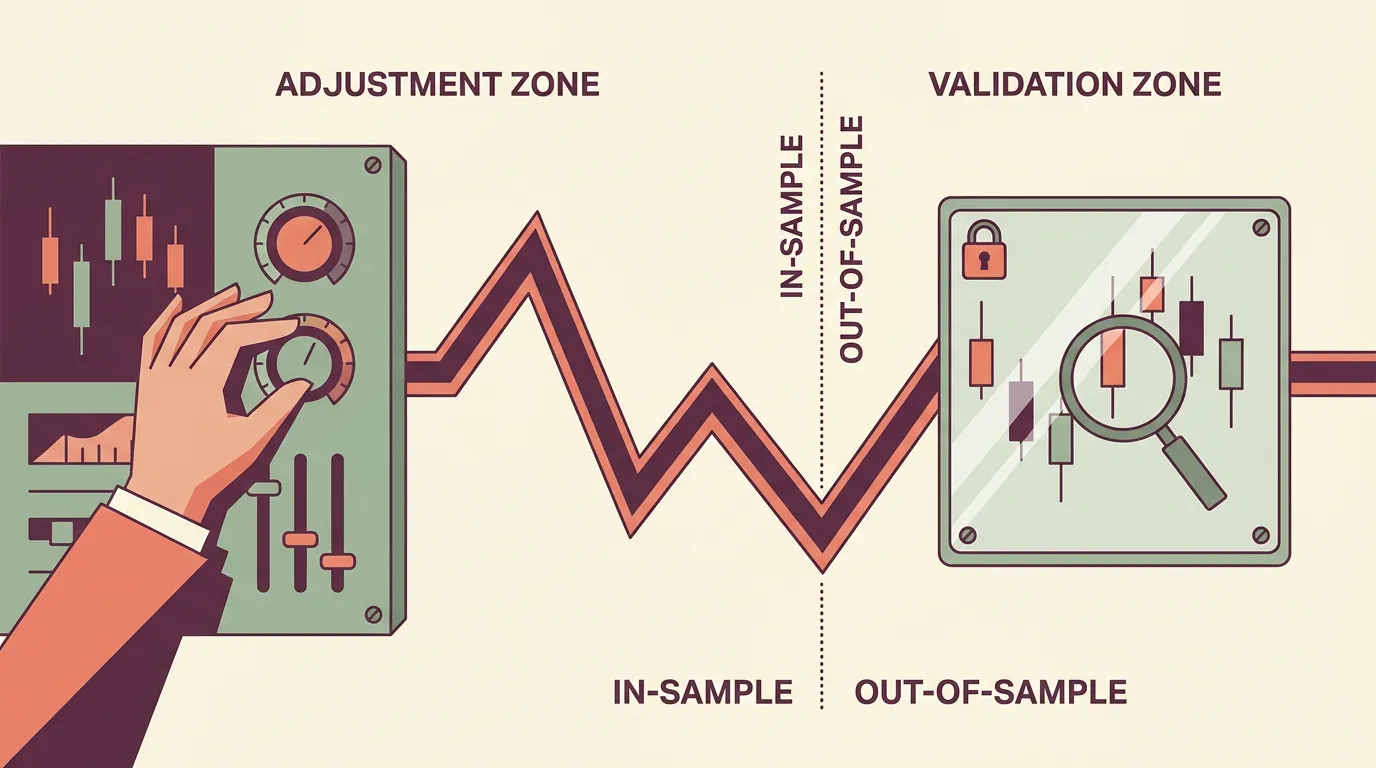
Why a perfect backtest should worry you
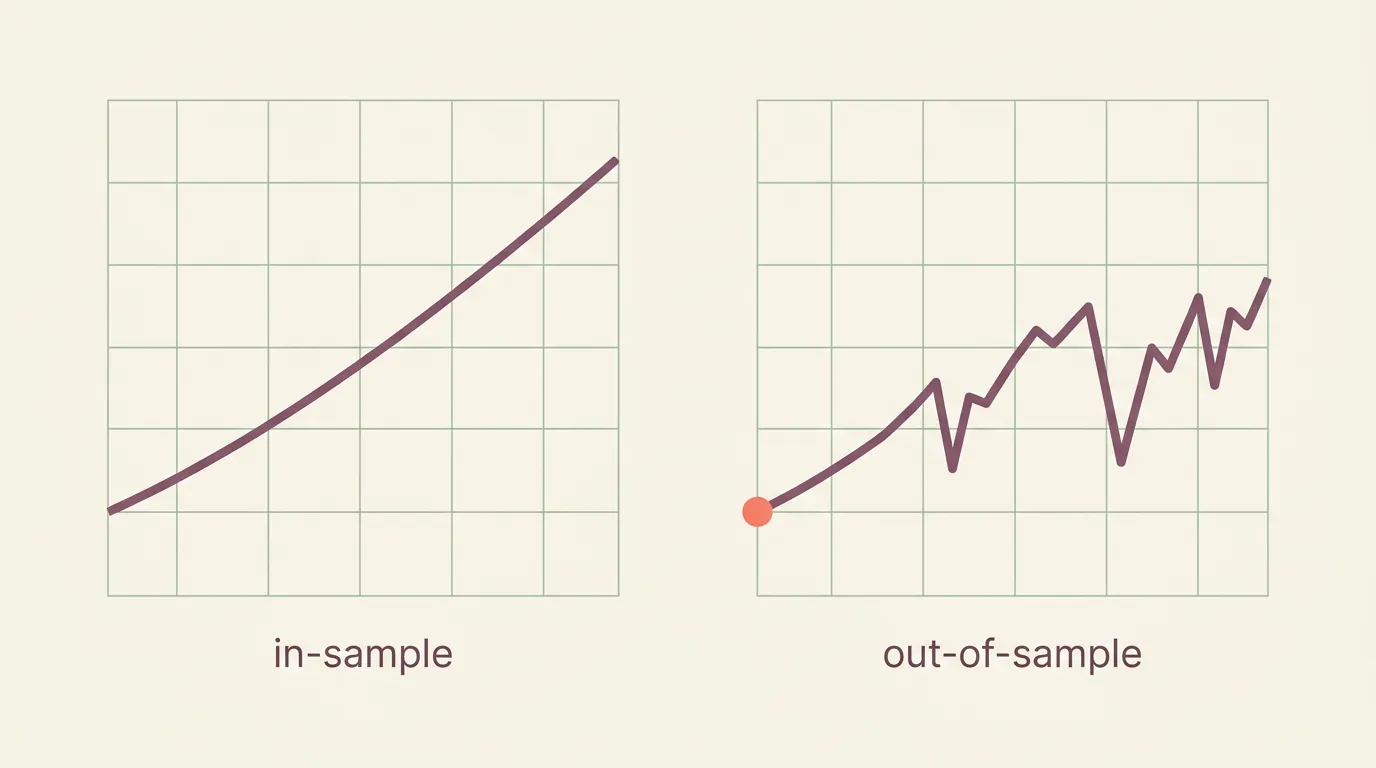
If your backtest shows a smooth, rising equity curve with barely a losing month, be suspicious. A result that good usually means the strategy was tuned to fit the exact history you tested on — including its random noise. That's overfitting, and it evaporates the moment real markets do something new.
Out-of-sample (OOS) testing is the cheapest, most reliable defense. The idea: optimize your strategy on one slice of history, then judge it on a slice it has never seen.
In-sample vs out-of-sample, in plain terms
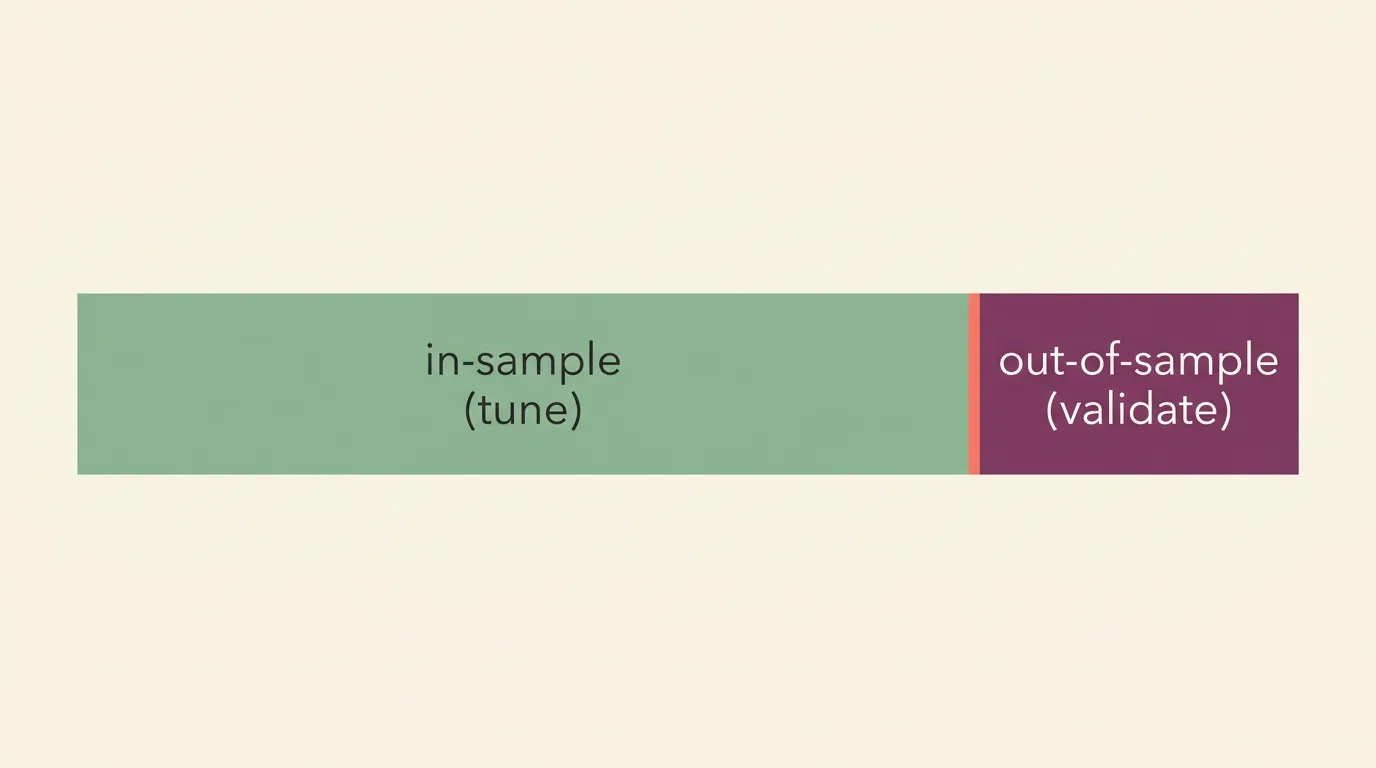
Split your historical data into two parts before you touch a single setting:
- In-sample (IS) — the data you're allowed to build, tweak, and optimize on. Typically the older 60–80%.
- Out-of-sample (OOS) — the newer 20–40%, locked away untouched until the very end.
You design and refine everything on the in-sample data. Then you run the finished strategy once on the out-of-sample data. If performance holds up roughly, you have real evidence. If it collapses, you overfit.
The out-of-sample set is only honest the first time you look at it. Peek, adjust, and re-run, and it quietly becomes in-sample data.
How to run an honest split
A workable routine most no-code traders can follow:
- Decide the split first. For example, reserve the most recent 12 months as OOS before you start experimenting.
- Do all your tinkering on the in-sample window. Change indicators, thresholds, stops — whatever you like.
- Freeze the strategy completely. No more parameter changes.
- Run it once on the out-of-sample window with realistic fees and slippage.
- Compare the two. A modest drop is normal. A dramatic one means the edge was noise.
If you run OOS, dislike the result, tweak a setting, and run it again, you've contaminated the test. Every re-run on the same data leaks information and inflates your confidence.
The signs of overfitting are worth memorizing: too many parameters, thresholds tuned to oddly precise values, brilliant in-sample results, and a strategy that only ever "worked" on one asset in one period.
Where this fits with everything else
Out-of-sample testing catches overfitting, but it isn't the whole job. It won't fix a backtest built on unrealistic fees, ignored slippage, or look-ahead bias — those distort both windows equally. Treat OOS as one layer in a stack: clean data, realistic costs, then out-of-sample validation, then a spell of .
On algomax you describe your strategy in plain language and the assistant turns it into a ready-to-run bot, so iterating is fast — which is exactly why the discipline matters. The friction that used to slow you down is gone, so the only thing stopping you over-optimizing is you. Do your , keep an OOS window untouched, and let the fresh data have the final word.
Test the same idea on a second, unrelated asset. If the edge survives on data it was never designed for, that's stronger evidence than any single tuned curve.
Key takeaways
- A flawless backtest is a red flag, not a green light — it usually signals overfitting.
- Split data before you start: build on in-sample, validate once on out-of-sample.
- Re-running OOS after tweaks ruins it — the honesty only lasts one look.
- OOS is one layer: pair it with realistic costs and a stretch of paper trading.
Frequently asked questions
What percentage of data should be out-of-sample?
A common split reserves the most recent 20–40% of your history for out-of-sample validation and uses the older 60–80% for building and tuning. The exact ratio matters less than choosing it before you start and never touching the reserved portion until the end.
Can I re-run the out-of-sample test if the result is bad?
Not without consequences. Each time you adjust a setting and re-run on the same out-of-sample data, you leak information into your decisions and the test stops being genuinely 'unseen.' If it fails, go back to in-sample data or accept that the edge may not be real.
Does out-of-sample testing guarantee my strategy will work live?
No. It reduces the risk of overfitting, but it can't fix unrealistic fees, slippage, or look-ahead bias, and it can't predict future market regimes. It's one important layer, best followed by paper trading before committing real money.
What's the difference between out-of-sample testing and paper trading?
Out-of-sample testing validates on historical data the strategy hasn't been optimized on, while paper trading runs the strategy forward on live market data without real money. Both check for overfitting, but paper trading also surfaces execution and timing issues a backtest can miss.