Moving Average Ribbon: Read Trend Strength at a Glance
A moving average ribbon stacks several MAs to show trend strength and momentum. Learn how to read the ribbon and automate it as a no-code trading bot.
What a moving average ribbon actually is
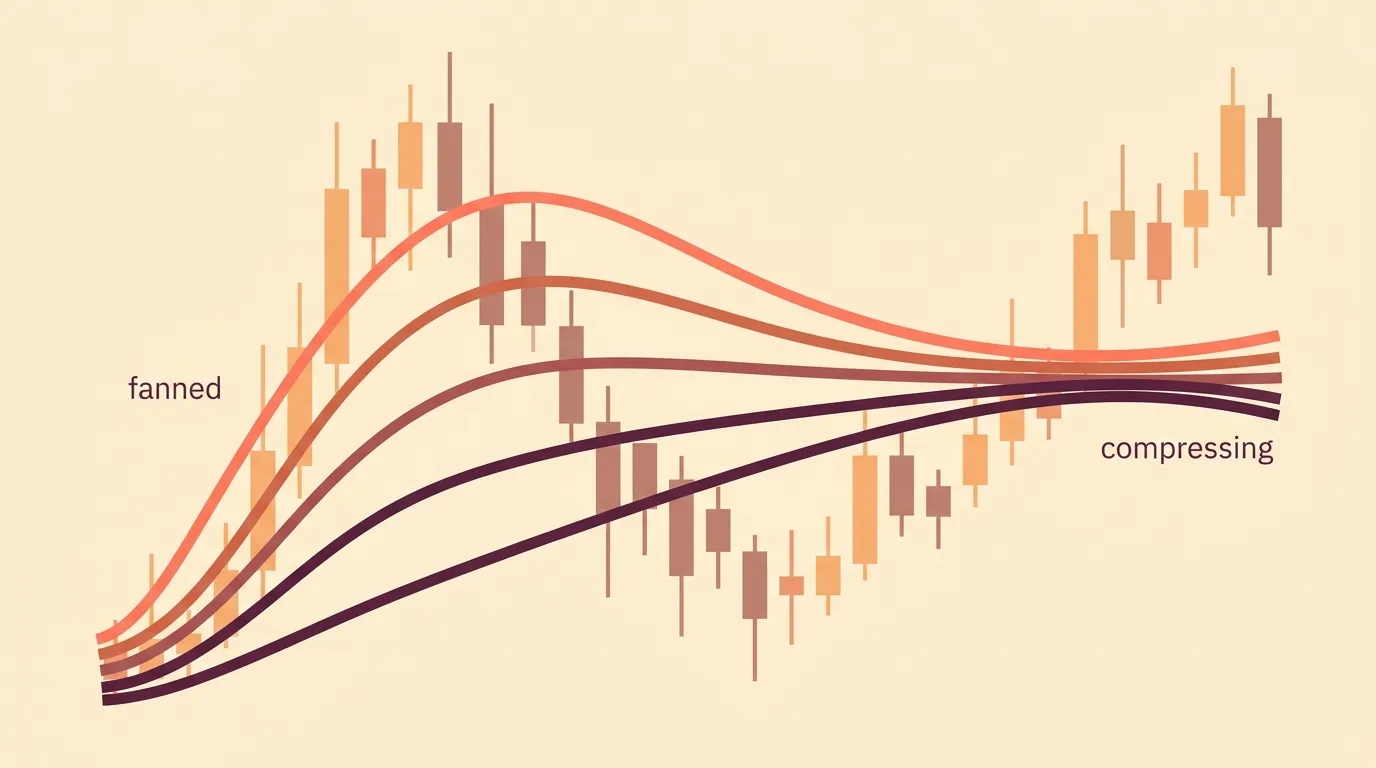
A moving average ribbon is simply several moving averages of different lengths plotted together — say 8, 13, 21, 34, 55. Instead of watching one line cross another, you watch the whole fan behave. The ribbon answers one question fast: how strong and how orderly is the current trend?
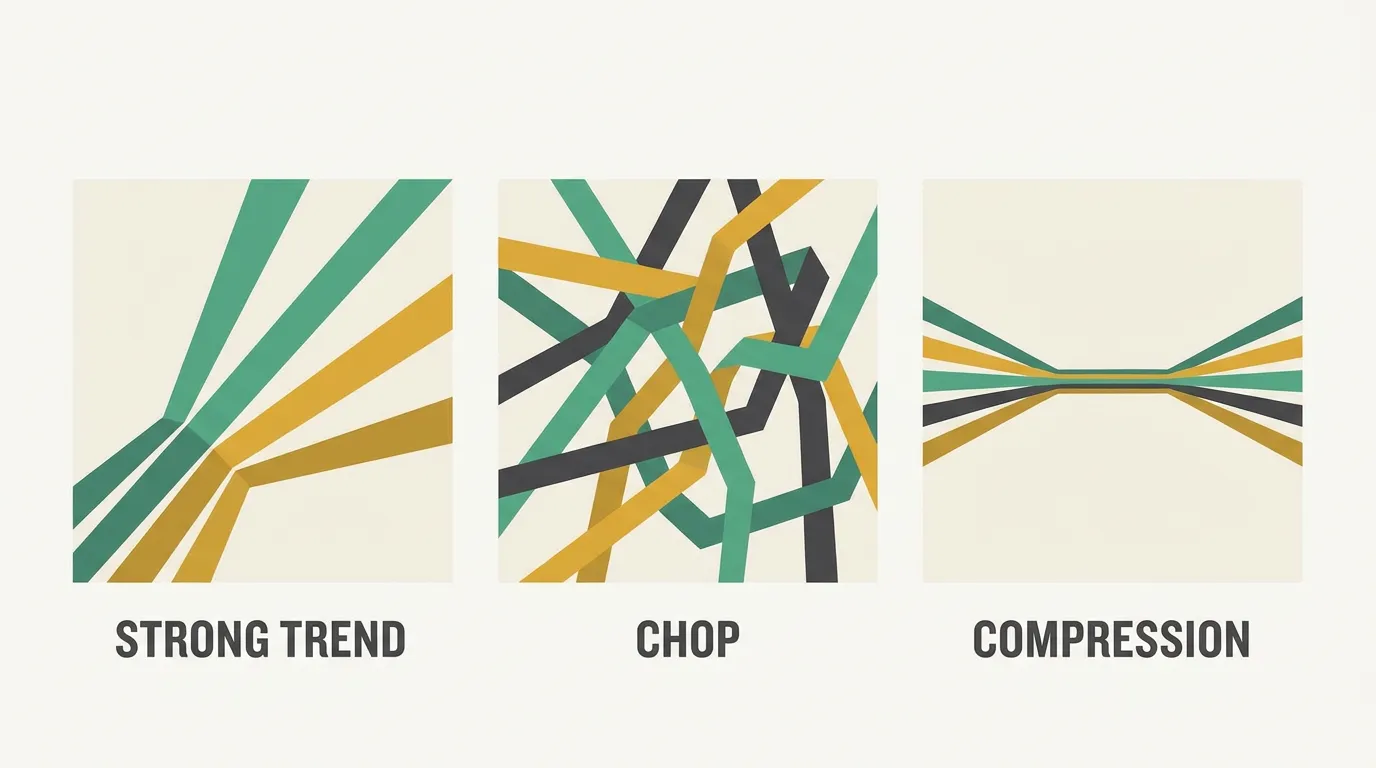
- Fanned out and evenly spaced → strong, healthy trend.
- Tangled and flat → no trend, choppy market. Stay out.
- Compressing (lines squeezing together) → momentum fading, possible reversal.
That visual read is the whole point. A single crossover gives you a yes/no signal; a ribbon gives you conviction.
How to read the ribbon for entries and exits
The ribbon is a trend filter first, a signal second. Order and spacing matter more than any single line.
- Alignment. In an uptrend the fastest MA sits on top and each slower one stacks below it, in order. Fully aligned = trend intact.
- Price vs. ribbon. Price above a rising ribbon confirms the up-move; a pullback that touches the ribbon and bounces is a classic continuation entry.
- Compression. When the lines pinch together, the trend is losing energy — a spot to tighten stops or step aside.
- Flip. When the order inverts (fast MAs drop below slow ones), the trend has likely rolled over.
A ribbon's real edge isn't a sharper entry — it's telling you when not to trade, when the lines are knotted and flat.
Use the ribbon as a gate on another signal. Only take your RSI or breakout entries when the ribbon is cleanly fanned in the same direction — it filters out the worst chop.
EMA vs SMA ribbons, and choosing periods
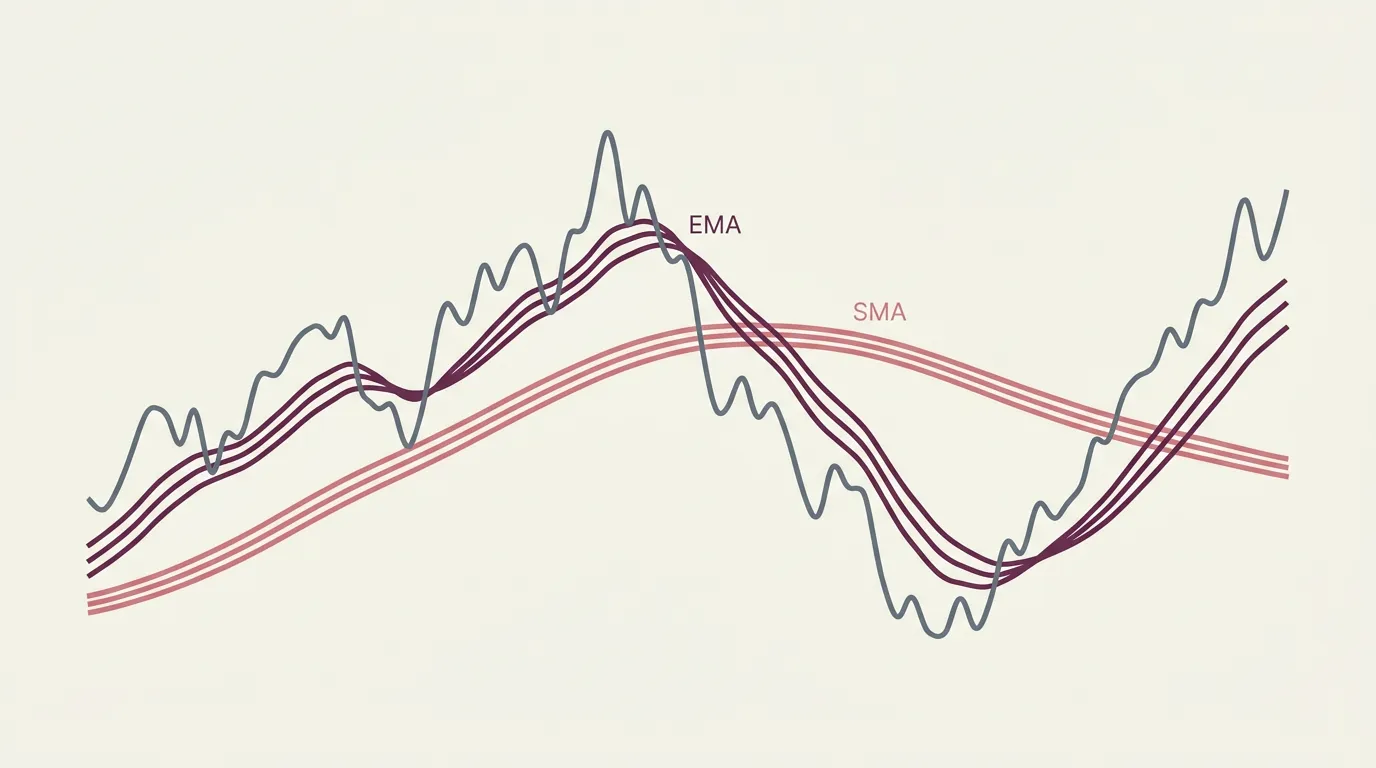
Whether you build the fan from EMAs or SMAs changes its personality:
For period selection, keep the spacing logical rather than arbitrary — many traders use a Fibonacci-style set (8, 13, 21, 34, 55) so each MA is meaningfully slower than the last. Fewer lines (three or four) are easier to read; more lines (six-plus) give a richer picture but blur the signal.
A ribbon is still a lagging, trend-following tool. In sideways markets it whipsaws — the fan tangles, gives false flips, and bleeds small losses. Pair it with a volatility filter and always .
Turning a ribbon into a running bot
You don't need to code a ribbon. On algomax you describe it in plain language — in your own words — and the AI assistant builds a ready-to-run bot. Something like "go long when the 8, 13, 21, 34 and 55 EMAs are stacked in order and price is above them; exit when the order inverts" is enough to start.
From there the workflow is straightforward:
- Backtest the ribbon rules on historical candles to see how the spacing and periods behaved.
- Add risk controls — a stop and position size, ideally tied to volatility. Our guide to the pairs well with a ribbon.
- Go live through your own connected broker, long-only or two-sided.
Because the setup is fully no-code, iterating is quick: adjust the number of lines or the timeframe in conversation, , and re-test.
Key takeaways
- A ribbon stacks several MAs so trend strength, alignment, and fading momentum are visible at a glance.
- Treat it as a trend filter — orderly fan = trade with it; tangled = stay out.
- EMA ribbons react faster; SMA ribbons are smoother — match the type to your timeframe.
- It lags and whips in ranges, so backtest and add volatility-based risk controls before running it live.
Frequently asked questions
What is a moving average ribbon?
It's a set of several moving averages of different lengths plotted together on one chart. The shape and spacing of the resulting fan show how strong and orderly the current trend is.
How many moving averages should a ribbon use?
Three or four lines are easy to read, while six or more give a richer picture at the cost of clarity. Many traders use a Fibonacci-style set like 8, 13, 21, 34, 55 so each line is meaningfully slower than the last.
Should I use EMA or SMA for a ribbon?
EMA ribbons react faster and suit shorter timeframes and momentum trading, while SMA ribbons are smoother and slower to flip, which fits higher timeframes and position trades. The best choice depends on your timeframe and how much lag you can tolerate.
Does a moving average ribbon work in sideways markets?
No — like all trend-following tools it whipsaws in ranges, tangling and giving false flips. Its main value there is warning you to stay out when the lines are knotted and flat.
Can I automate a ribbon strategy without coding?
Yes. On algomax you describe the ribbon rules in plain language, the AI builds a ready-to-run bot, and you can backtest it on historical candles before running it live through your own broker.